Generate matrix composed of a sparse matrix and low-rank matrix
Source:R/generate.matrix.R
generate.matrix.RdGenerate simulated matrix that is the superposition of a low-rank component and a sparse component.
generate.matrix(
  n,
  p,
  rank = NULL,
  support.size = NULL,
  beta = NULL,
  snr = Inf,
  sigma = NULL,
  seed = 1
)
Arguments
- n
The number of observations.
- p
The number of predictors of interest.
- rank
The rank of low-rank matrix.
- support.size
The number of nonzero coefficients in the underlying regression model. Can be omitted if
betais supplied.- beta
The coefficient values in the underlying regression model. If it is supplied,
support.sizewould be omitted.- snr
A positive value controlling the signal-to-noise ratio (SNR). A larger SNR implies the identification of sparse matrix is much easier. Default
snr = Infenforces no noise exists.- sigma
A numerical value supplied the variance of the gaussian noise. Default
sigma = NULLimplies it is determined bysnr.- seed
random seed. Default:
seed = 1.
Value
A list object comprising:
- x
An \(n\)-by-\(p\) matrix.
- L
The latent low rank matrix.
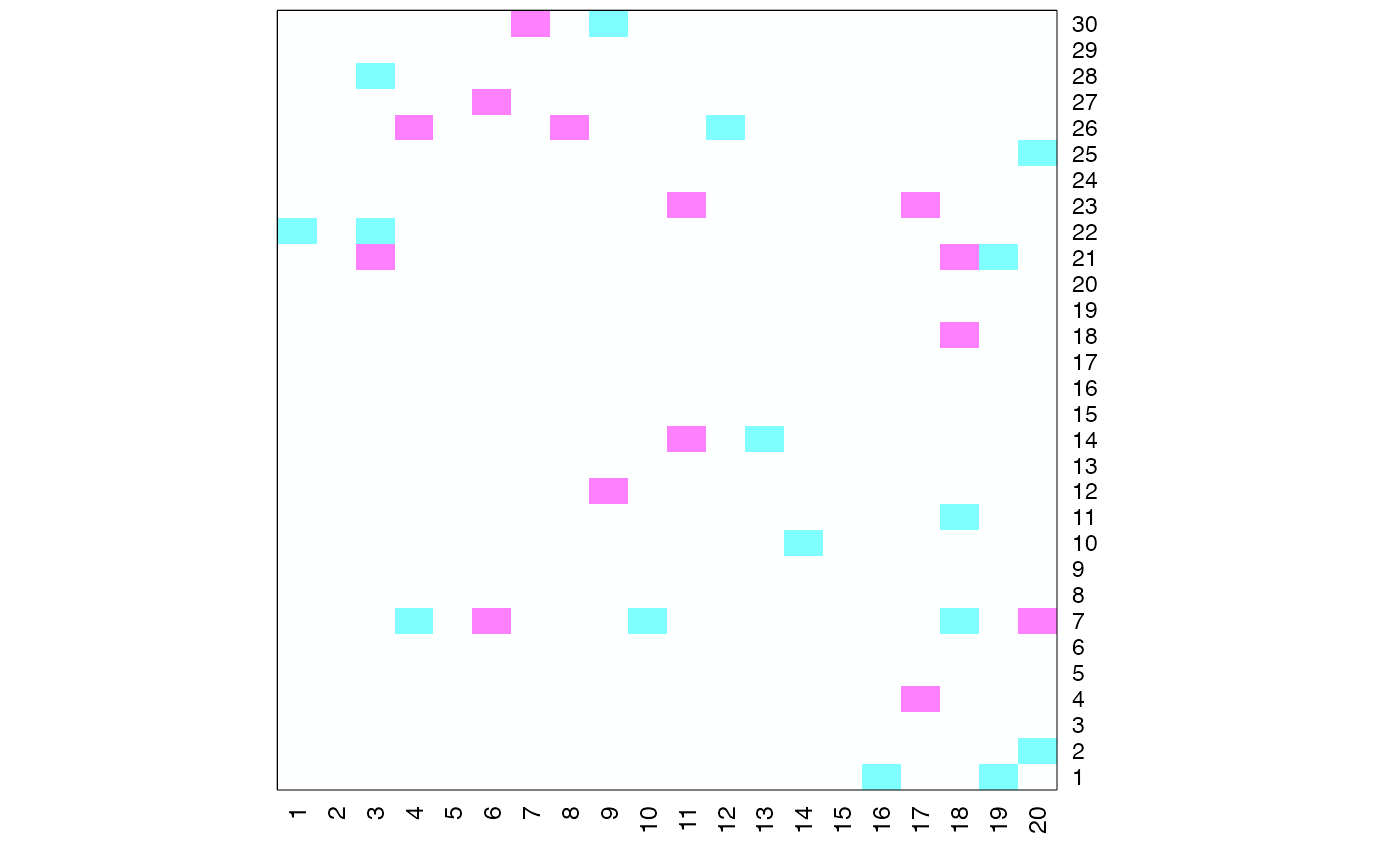
- S
The latent sparse matrix.
Details
The low rank matrix \(L\) is generated by \(L = UV\), where \(U\) is an \(n\)-by-\(rank\) matrix and \(V\) is a \(rank\)-by-\(p\) matrix. Each element in \(U\) (or \(V\)) are i.i.d. drawn from \(N(0, 1/n)\).
The sparse matrix \(S\) is an \(n\)-by-\(rank\) matrix.
It is generated by choosing a support set of size
support.size uniformly at random.
The non-zero entries in \(S\) are independent Bernoulli (-1, +1) entries.
The noise matrix \(N\) is an \(n\)-by-\(rank\) matrix, the elements in \(N\) are i.i.d. gaussian random variable with standard deviation \(\sigma\).
The SNR is defined as as the variance of vectorized matrix \(L + S\) divided by \(\sigma^2\).
The matrix \(x\) is the superposition of \(L\), \(S\), \(N\): $$x = L + S + N.$$